
Taxation Rates for 2025
| Rate of Taxation Bylaw 2025 | ||||
| Residential & Primary Residential | Tourist Home | Non Residential (including Visitor Accommodation) | Residential Vacant Serviced & Unserviced Land | |
| Municipal | 1.95440 | 5.80705 | 5.80705 | 1.95440 |
| Provincial Education Tax | 2.57771 | 2.57771 | 3.68933 | 2.57771 |
| Seniors Requisition* | 0.12220 | 0.12220 | 0.12220 | 0.12220 |
| Vital Homes | 0.01550 | 0.10231 | 0.10231 | 0.01550 |
| Total Mill Rate | 4.66981 | 8.60927 | 9.72089 | 4.66981 |
* Senior Req. Rate is for Bow Valley Regional Housing (BVRH)
To calculate your levy amount: Assessed Property Value x Rate / 1000 = Tax Levy
Previous Rates: Mill Rates Chart 2014 - present
Tax Rate Information
The Town of Canmore collects just enough property taxes to cover operating budget requirements, the provincial education tax requisition, and the seniors requisition. To determine the tax rate - or mill rate - administration calculates how much of the total is to be collected from residential and non-residential properties (the split), then divides these amounts by the total assessed value for each property classification.
Property Tax Rates are set by Council in May annually. Property Tax Notices for the current taxation year (January 1 - December 31) are mailed in late May. Property Taxes are traditionally due on the last business day of June. Review your Annual Property Tax Notice to confirm the due date for the current year.
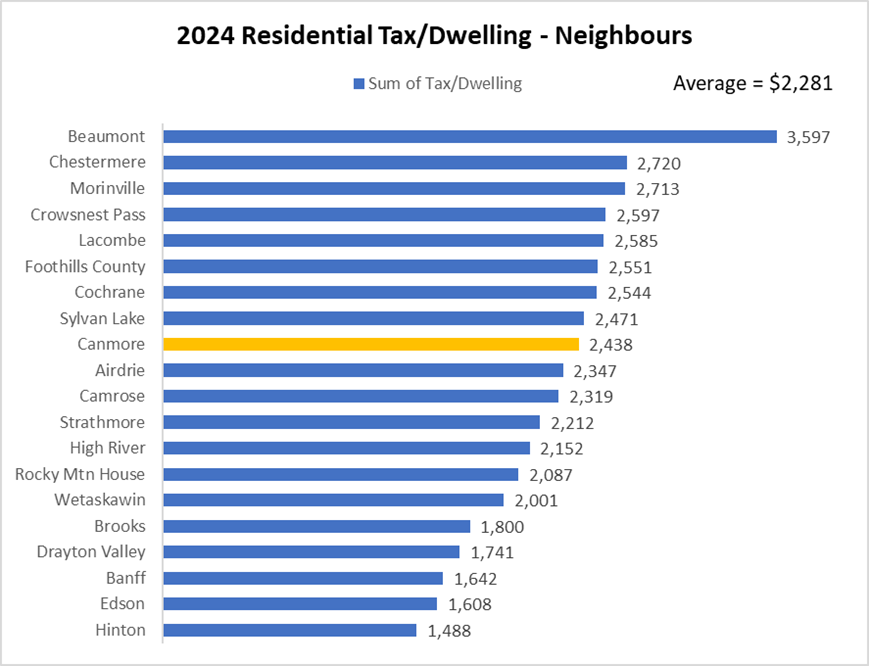
We regularly monitor the tax rates in other municipalities. The intent of the Town of Canmore Property Tax Policy is to target a residential:non-residential tax share split in line with the average of similar communities. As you can see in the chart, Canmore's municipal taxes are in line with the average taxes per dwelling of many of our neighbours.
We compare taxes based on the number dwellings being taxed, rather than per capita, since we have such a large, non-permanent population, and it is difficult to determine the number of non-permanent residents. Therefore, the per capita calculation did not result in a clear comparison.